

When is information real or fake? 3 recommendations for avoiding being taken in by fake news...
We’re surrounded by information and data….how do we know what is real, what is “fake news” or even “propaganda”? And do we know what information is useful to us?
When we think of “propaganda” we maybe think of state controlled information from a dictatorship government. Or perhaps information circulated that reflects just one extreme view. Whereas a simple definition would be ‘the dissemination of information to influence public opinion.’ in other words, really not that extreme.
And the term “fake news” has been much more mainstream since ex-President Trump used it to refer to any news he did not like. It could also mean information circulated to look like news but is actually misleading.
So, my first recommendation would be to get your information from a reliable source - think mainstream media rather than ‘Dave down the pub’* or your neighbour’s auntie’s dog via facebook!!

Reliable source?
This image is from Scottish newspaper The National showing Scotland football fans in London for their recent match against England
What do you think of when you see this image? Football hooligans, drunken behaviour, disruption, and so on? The picture is from a reliable media outlet and could certainly be used to tell a story or back up a particular opinion piece on Scotsmen and/or football fans.
But, what if you see the whole image……..?

The article was actually telling the story of a group of Scottish football fans the day after the match with England who were picking up litter and cleaning up the mess left from the night before.
I took the liberty of cropping the picture to make a point (not something done by The National). Which brings me to my second recommendation is to look at a variety of sources for your information. Not only to verify what you are reading but also to get a mix of opinions, not just rely on people who think the same as you do, avoid finding yourself in an echo chamber.
If you rely on receiving information on social media and have a relatively homogenous group of connections / friends, you are likely to only see information you already agree with, its a side effect of the inbuilt algorithms. In HR terms, it would be like trying to solve turnover issues that you already know exist by only looking at turnover data to define the problem. What you really need is a variety of information and data such as exit interviews, engagement data, absence data, salary benchmarking, etc to get to the root causes of your turnover issue before you can implement appropriate solutions.
But even when you know you have accurate or “real” information, how it is presented can make a big difference to how the information is received and what meaning is taken from it. My third and final recommendation is to sense check what data or information you are seeing….is there bias in how the presentation is set up, are you seeing the whole picture or is only selected information included, does the data actually answer the question being asked? Take this example:
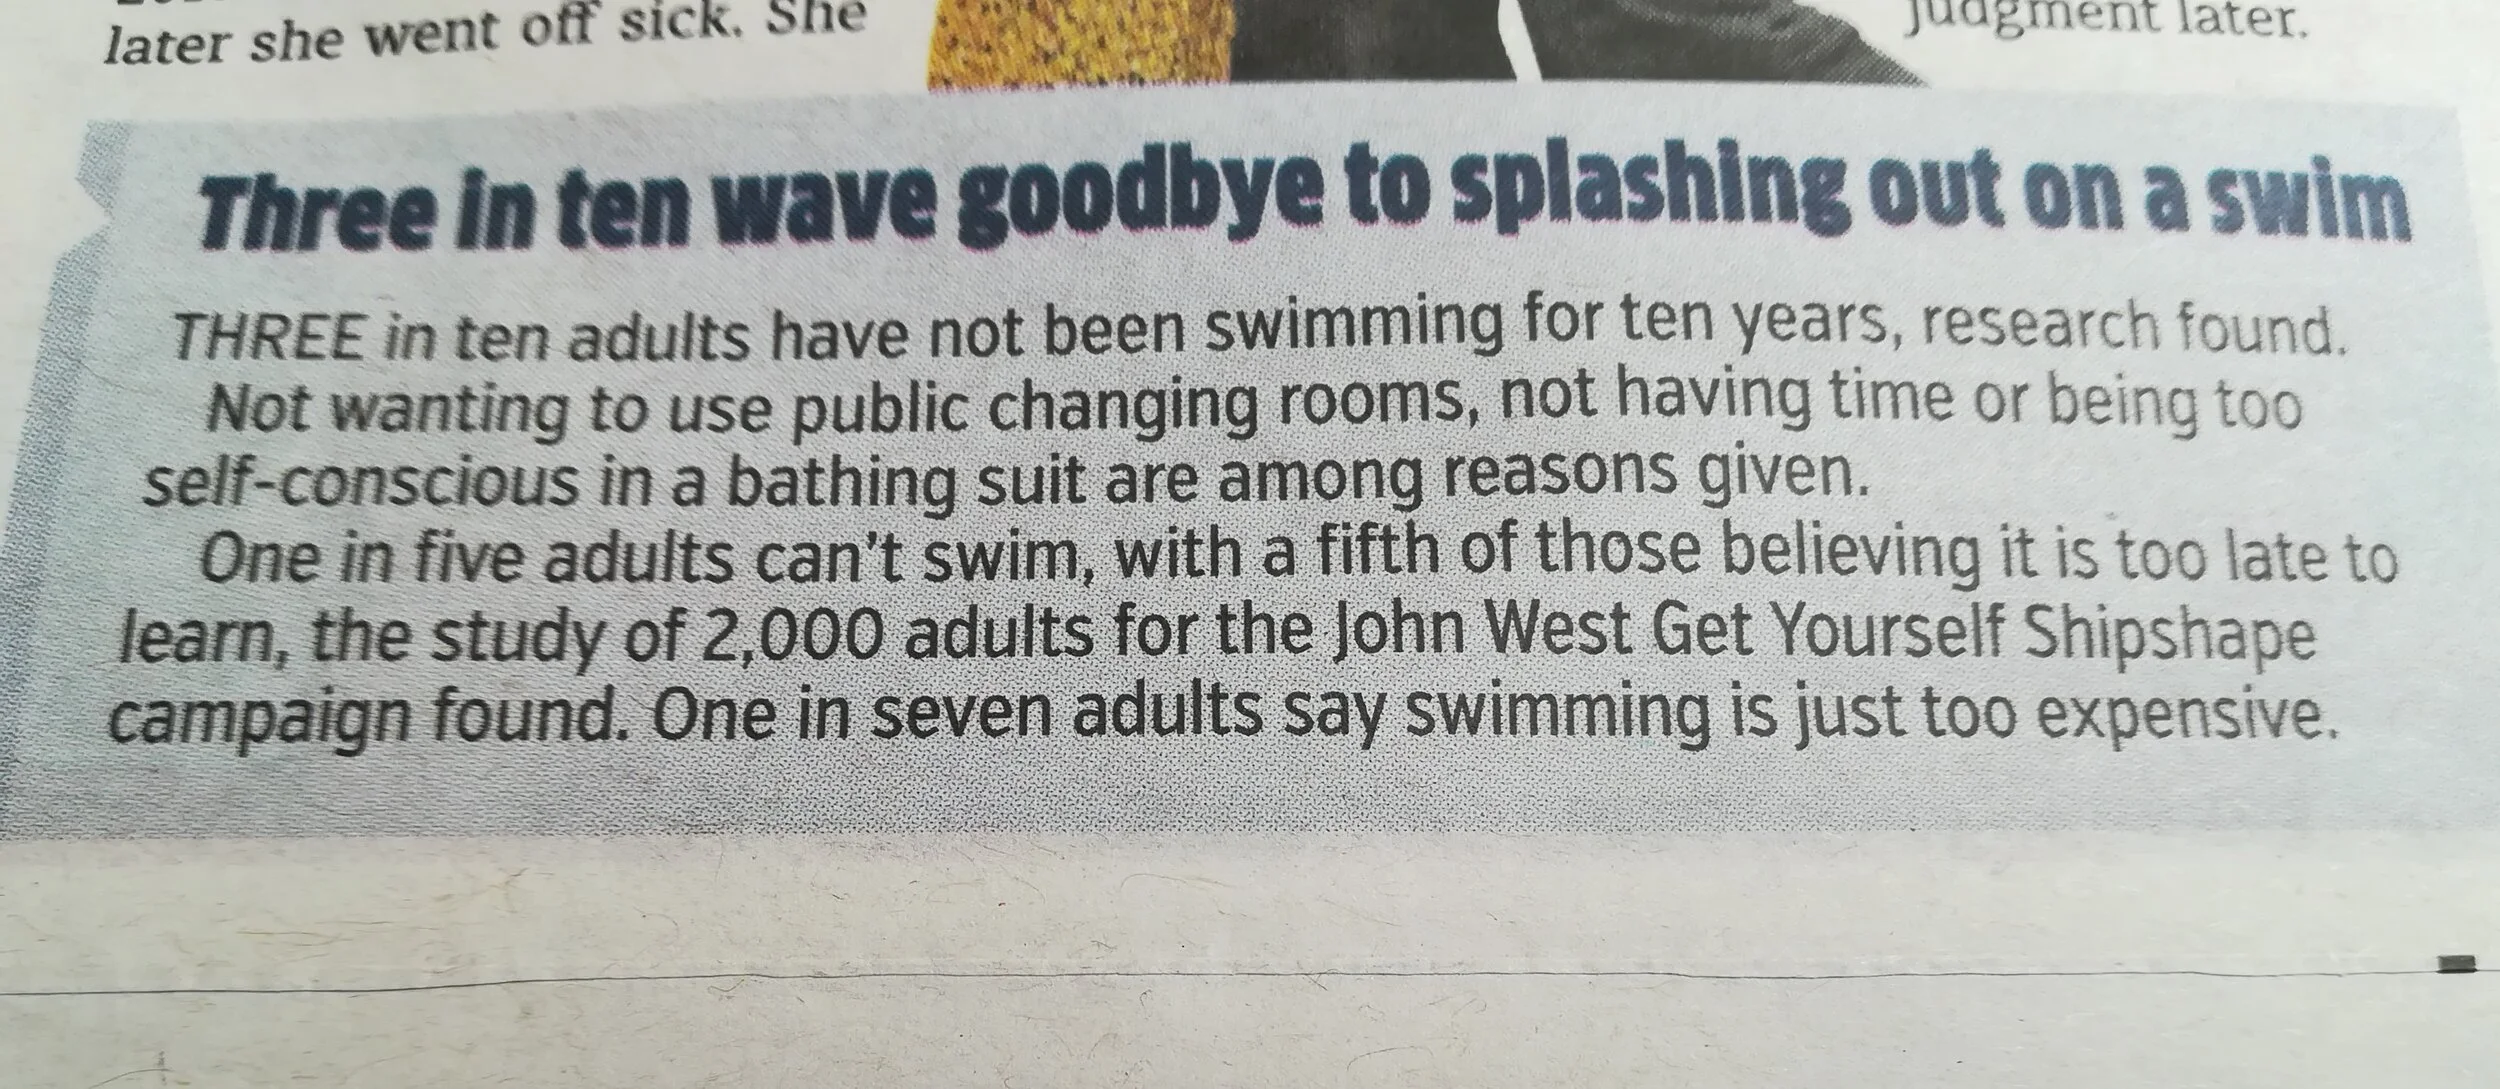
This short article was taken from national newspaper The Metro, probably reliable and not too biased. However, the data they are quoting was from research for a fitness campaign by a food company, which may affect the questions being asked. What the article does mention is the sample size of 2,000 for the research, a good amount of people to provide meaningful results.
In this particular case, I am not too concerned about any particular bias or reliability. My concern in this article is the headline……whilst potentially true (3 in 10 adults have not swum in at least ten years) it is misrepresenting the data. By writing the headline as “wave goodbye to splashing out” this implies not spending money and the data is that only 1 in seven think swimming is too expensive, much less than the three in ten quoted in the headline (14% as opposed to 30%) . Also, as one in five cannot swim at all, they would never be going swimming anyway.
In my opinion, this is a typical example of using the data to back up your opinion and write your headline. In HR terms, this would be similar to just providing a headline absence rate to your senior management team without any reference to absence rates for locations or departments and without any other break down of the information. And remember that if you achieve, for example, 85% positive ratings from new starters on your onboarding, you still have 15% of new starters who are not positive - are they negative, did they forget to respond to your survey request, why have they not given the positive rating?
To recap, my recommendations on keeping it real are:
use a reliable source for your information and data
check a variety of sources to avoid bias
sense check the data presentation and inferences made
If you need support on your HR information and data, your sources or your presentation, get in touch with me at CG Pro-Active HR for assistance, initial consultations are free of charge.
* with apologies to all Daves reading this blog 😊

